“Atmospheric Dynamics Unveiled: Exploring the Polar Vortex, the North Atlantic Oscillation and Arctic Oscillation’s Impact on Winter Weather”

Meteorologists indeed keep a keen eye on the polar vortex due to its crucial influence on weather patterns throughout the Northern Hemisphere. The polar vortex, a large area of low pressure and cold air surrounding both of Earth’s poles, acts as a key player in shaping atmospheric circulation.

Alterations in the intensity and location of the polar vortex can result in notable weather irregularities, such as severe cold spells, intensified winter storms, and alterations in the jet stream’s trajectory. These variations have far-reaching implications for weather forecasting, as well as for climate research endeavors.

By comprehending and foreseeing these fluctuations, meteorologists can enhance their ability to predict and prepare for weather events, ultimately aiding in the mitigation of potential risks associated with extreme weather phenomena. Furthermore, a deeper understanding of the polar vortex assists scientists in unraveling the complexities of our planet’s climate system, contributing to advancements in climate science and our overall comprehension of Earth’s atmospheric dynamics.

Source: https://scijinks.gov/polar-vortex/

The text also discusses the connection between the polar vortex and the Arctic Oscillation (AO), emphasizing their influence on winter weather in the United States and Europe. It explains that the polar vortex, a permanent atmospheric circulation feature, contains the coldest air at the poles. The polar jet stream, marking the outer edge of the vortex, is influenced by temperature, wind, and air pressure patterns that extend from high altitudes to the surface, particularly in winter.

The Arctic Oscillation describes coordinated shifts in the polar vortex’s characteristics, affecting air pressure, temperature, and the jet stream’s location and strength. A strong polar vortex, with higher pressure over the Arctic, results in milder conditions in mid-latitudes, while a weak vortex, characterized by lower Arctic pressure, allows frigid air to move southward. The AO Index tracks these variations.


Source: https://www.ncei.noaa.gov/access/monitoring/ao/

The text notes a recent cold outbreak, attributing it to a weakened polar vortex near North America and eastern Siberia. Unlike a complete vortex breakdown, parts of the Arctic Circle experienced warmer temperatures. It contrasts this event with the classic example of a strong negative AO phase in 2009-2010, causing widespread cold outbreaks in North America, Siberia, and Europe.

While the AO has not shown a strongly negative phase recently, there is a trend of more frequent negative phases since the mid-1990s, and researchers are exploring factors like natural variability, sea ice loss, and snow cover influence. The Climate Prediction Center forecasts the AO and North Atlantic Oscillation (NAO) up to two weeks ahead, indicating potential cold snaps in the central and eastern United States. However, model predictions for the Arctic Oscillation’s phase show a mixed outlook, with low confidence in the forecast for the end of January. The text also mentions the interrelation between AO and NAO during the winter, citing a deviation in alignment during the cold outbreak in early 2014.


The North Atlantic Oscillation (NAO) and Arctic Oscillation (AO) are climate indices that represent patterns of atmospheric pressure variations in the Northern Hemisphere. These indices are primarily associated with large-scale weather patterns and climate variability but are not directly related to ships.

The NAO is characterized by the difference in atmospheric pressure between the subtropical high-pressure system near the Azores and the subpolar low-pressure system near Iceland. It has two phases: positive and negative. A positive NAO is associated with stronger westerly winds and milder, wetter conditions over northern Europe, while a negative NAO is linked to weaker westerly winds and colder, drier conditions.

The AO represents the state of atmospheric circulation over the Arctic region. It is measured by the difference in atmospheric pressure between the Arctic and the middle latitudes. The positive phase of the AO is associated with a strong polar vortex and milder conditions in the mid-latitudes, while the negative phase is linked to a weaker polar vortex and increased chances of cold outbreaks in the mid-latitudes.

The relationship between these indices and ships is indirect. The NAO and AO influence the prevailing weather patterns, which can impact shipping routes, sea ice conditions, and overall maritime weather in the North Atlantic region. For example, during a negative NAO or AO phase, colder conditions may prevail, potentially affecting shipping operations. However, it’s essential to note that while these indices can provide insights into long-term climate trends, short-term weather conditions are influenced by various factors, and their direct impact on specific ship operations can vary.


Source: https://www.severe-weather.eu/


Meteorologist: Nikos Koulakis

The Mesoscale Convective Systems

Mesoscale Convective Systems (MCS)

A mesoscale convective system (MCS) is a complex of thunderstorms that becomes organized on a scale larger than the individual thunderstorms but smaller than extratropicali cyclones, and normally persists for several hours or more.

Picture 1. A great deal of lightning was associated with this MCS as it propagated eastward across the Gulf of Mexico, with the storm often producing over 1000 cloud-to-ground strikes within a 15-minute period.


Forms of MCS that develop within the tropics use either the Intertropical Convergence Zone (ITCZ) or monsoon troughs as a focus for their development, generally within the warm season between spring and fall.

Mesoscale convective systems (MCSs) are a key component in the Earth’s energy and hydrological cycles. They can grow to hundreds of kilometers in size, last for more than a day, and produce a majority of the annual rainfall in manyregions of the world. (C.D. Ahrens & R. Henson).


Picture 2. For the first time mesoscale convective systems (MCSs) in both the tropics and midlatitudes and all seasons can be tracked over many years by a new algorithm jointly using satellite observed cloud-top temperature and surface precipitation features at hourly and 10-km resolution globally (top panel). Results show that MCSs account for over 50% of the annual rainfall across the tropics and many regions of the subtropics and midlatitudes (bottom panel). Credit: Feng et al. [2021].


Forms of Mesoscale Convective Systems (MCS)


Mesoscale convective complexes (MCCs) —A particular type of MCS, an MCC is a large, circular, long-lived cluster of showers and thunderstorms identified by satellite. It often emerges out of other storm types during the late-night and early-morning hours. MCCs can cover an entire state. (N.O.A.A).


Picture 3. A Mesoscale Convective Complex (MCC) from satellite GOES – 8 on behalf of National Oceanic and Atmospheric Administration.


Mesoscale Convective Vortex (MCV)


Mesoscale Convective Vortices (MCVs) are midtropospheric warm-core cyclonic circulations that often develop in the stratiform region of mesoscale convective systems. Typically, divergent, anticyclonically circulating, mesoscale cold anomalies appear both above and below the MCV. The upper-level cold anomaly is usually found near the tropopause while the low-level anomaly is surface based and exhibits locally higher pressure. One aspect of MCVs that has received much attention recently is the role that they may play in tropical cyclogenesis. Of special interest is how an MCV amplifies when deep convection redevelops within the borders of its midlevel cyclonic circulation and how the amplified MCV transforms the divergent surface-based cold pool with anomalously high surface pressure into a convergent cyclonic circulation with anomalously low pressure. (Robert F. Rogers and J. Michael Fritsch, 1, April 2001).


Picture 4. A mesoscale convective vortex over Pennsylvania with a trailing squall line.


Derecho

Derecho is a widespread and long-lived windstorm associated with a line of severe thunderstorms. It is characterized by straight-line winds that can exceed 58 miles per hour and can cause significant damage.

Derecho development is necessarily tied to the formation of bow echoes. A bow echo usually arises from a cluster of thunderstorms, but also may evolve from a single strong storm. Bow echoes most frequently occur when atmospheric winds are relatively strong and unidirectional (i.e., they vary little in direction with height but increase in speed). As the rain-cooled downdraft of a thunderstorm reaches the earth’s surface, it spreads horizontally, most rapidly in the direction of the mean atmospheric flow. (N.O.A.A).


Nikolaos Koulakis – Meteorologist & Weather Routing Analyst of Oceanroute

Figure 1

Meteorology & Tropical Cyclones


The majority of people today are familiar with Tropical Cyclones, which often cause severe damage to nature and humanity in certain regions of our globe.
Almost always however, people are not aware of basic meteorology fundamentals, such as how and why Tropical Cyclones are more powerful and severe than normal Storms.
Therefore, they resist conforming to societal standards and challenging the might of nature.
Due to the fact that storms and tropical cyclones in general tent to become more intense as a result of climate change, it is vital that we learn useful knowledge about them.

First, Tropical Cyclone is an umbrella word encompassing cyclones that originate in tropical oceans. At the North Atlantic and Eastern North Pacific Ocean, for example, the National Hurricane Center (NHC) defines a Tropical Cyclone as an area of low pressure with a warm core at its center that develops over Tropical or Sub-Tropical waters and is depicted on a surface chart by a number of closed circular isobars, with associated steep pressure gradients.

Tropical Cyclones are often classified according to the intensity of their strongest related winds:
(1) Tropical Depression (TD) – wind speed at the surface is less than 33 knots (7bf)
(2) Moderate Tropical Storm (TS) – wind speed at the surface ranges between 34 and 47 knots (8-9bf)
(3) Severe Tropical Storm (STS) – surface wind speeds between  48 and 63 knots (10-11bf)
(4) Hurricane (Hu) – wind speed at the surface of 64 knots or higher (>12bf)
(5) Major Hurricane (MHu) – wind speed at the surface reaches 96 knots (>12bf)

During particular seasons, tropical cyclones develop and affect virtually exclusively six separate regions. In particular, you may view the occurrence locations, terminology and season listed below:
(1) North Atlantic Ocean (including Caribbean Sea & Gulf of Mexico) – Hurricane Season: May through November
(2) Eastern North Pacific Ocean – Hurricane Season: May through November
(3) Western North Pacific Ocean – Typhoon Season: April through December
(4) North Indian Ocean (including Bay of Bengal & Arabian Sea) – Cyclone Season: April through December
(5) Western South & Eastern South Indian Ocean – Cyclone Season: November through April
(6) Western South Pacific Ocean – Cyclone Season: November through April

Figure 1

Figure depicts the worldwide tracks of every Tropical Cyclones of at least Tropical Storm intensity from 1980 to 2018 (38 years) based on IBTrACS dataset. (source: Scientific Data / ISSN 2052-4463)


Tropical Cyclones develop from preexisting disturbances, which are often convective cloud clusters accompanied by a low-level cyclonic vorticity maximum, such as a tropical wave. Due to the pressure gradient effect, air will flow inward into the low-pressure region where low-level vorticity is present. As a result of the Coriolis force, incoming air is deflected to the right in Northern Hemisphere (left in Southern) and a counterclockwise circulation is produced.
Near the area of lowest pressure, the inflow of air causes low-level convergence, which in turn causes rising motion and deep convection. Tropical Cyclone is essentially a heat engine, with the underlying water serving as its heat supply. According to research, the sea surface temperature must be at least 27 degrees Celsius. At this temperature saturated air contains a great deal of water vapor, and when the air ascends, adiabatic cooling induces condensation with the release of latent heat of vaporization, which is the energy source for the development and maintenance of tropical cyclones.
In addition, the vertical wind shear, which refers to the variation in wind speed with height, must be sufficiently low, less than 15 to 20 knots from the surface to the high troposphere.

Figure 2


A Tropical Cyclone has an average diameter of around 700km a core pressure of 960 hPa at mean sea level and very steep pressure gradients. Nevertheless, its diameter and pressure levels change during its lifetime. The center of the system is dominated by a 55-kilometer-diameter eye, or vortex, in which calm conditions predominate. However, winds of Beaufort Force 12 or higher are present directly outside of this region. The eye is encircled by the eye wall, which is a ring of Cumulonimbus clouds, and has normally cloudless sky. The perimeter is characterized by dense cloud bands from which torrential rains pour, derived by regions with little rain or no precipitation.
It is crucial to note that tropical cyclones typically take several days or a week to develop from a chaotic collection of thunderstorms to hurricane strength, however this change has occurred in less than a day on rare occasions. If environmental circumstances are favorable, tropical cyclones will assemble, migrate, and intensify. When they encounter a land, they lose their vigor and become weaken (doing Landfall).

Figure 3

           Eye of a Tropical Cyclone, as well as Cumulonimbus cloud bands surrounding it (source: NASA/Nick Hague).


The sophistication of guidance products supplied by operational prediction centers across the world and the accuracy with which Tropical Cyclone tracks may be forecasted have vastly improved over the past several decades. For instance, in 1970s, the average 72-hour Atlantic basin tropical storm or hurricane prediction error was greater than 350 nautical miles, but in the present day, the average error is less than 100 nautical miles. Several Regional Specialized Meteorological Centers (RSMCs) are authorized by the World Meteorological Organization (WMO) to provide tropical storm predictions and alerts.
When a tropical storm is active, the National Hurricane Center
(NHC – https://www.nhc.noaa.gov/ ) produces tropical cyclone warning packages that include many official text and graphical products. Every six hours at 0300, 0900, 1500 and 2100 UTC, this suite of advisory products is published. Public Advisory, Forecast/Advisory, Tropical Cyclone Discussion and Wind Speed Probability are the principal text products.

Figure 5

                                 A sample of a picture produced by Typhoon (26W) Nalgae in the South Chinas Sea.


In addition, the Tropical Cyclone Track Forecast Cone and Watch/Warning Graphic depicts the most recent NHC track forecast of a tropical cyclone’s center, as well as an approximation of coastal areas under a hurricane warning (red), hurricane watch (pink), tropical storm warning (blue) and tropical storm watch (green) (yellow). The orange circle indicates the present location the tropical cyclone’s center. The cone indicates the track of a tropical cyclone’s core and is constructed by enclosing the region blown out by a series of rings along the predicted trajectory.

Figure 7


The Tropical Cyclone Danger Graphic is a product of the National Hurricane Center that is based on the “Mariner’s 1-2-3 rule”. The images illustrate the danger zone associated with tropical storms from the equator to 60°N between 0° and 100°W, including the Pacific East of 100°W, and from the equator to 40°N between 80°W and 175°W, including the Gulf of Mexico and Western Caribbean.
Add 100, 200 and 300 nautical miles to the tropical storm force 34 knots at the 24, 48, and 72-hour forecast locations, respectively, to establish the danger zone.
Given the improvements in forecasting and the increasing availability of receiving these forecasts at sea , the most effective way to avoid an encounter with a tropical cyclone is to monitor the forecast products from the appropriate RSMC or TCWC and take early action, which includes determining the tropical cyclone’s location and direction of travel relative to the vessel and maneuvering the vessel accordingly. To retain situational awareness and safety in the midst of severe storms, a mariner must be skilled at recognizing and categorizing environmental changes. Typically, the first observable evidence of a tropical cyclone’s existence is the appearance of extremely lengthy swells.

Figure 8


If the ship is within the cyclonic circulation, the first step is to calculate the ship’s position relative to the storm center. While the vessel may still make substantial progress through the water, a path should be chosen to take it as far from the center as feasible. Assuming the vessel can travel faster than the storm, it is reasonably easy to outrun the storm if there is sufficient sea room. But when the storm is more intense, the answer is not as straightforward.

Stratos Avgerinos Meteorologist – Weather Routing Analyst – Oceanroute S.A.

interior-tribunal-jueces-abogado_53562-6431

Speed & Consumption Warranties

Good weather conditions definition – Significant Wave Height & Douglas Sea State 

In order to better understand the context of Speed & Performance Claims, as well as several wordings we come across to Charter Parties when it comes to vessel’s performance and Weather Clauses, we will examine the case of a time charter trip from South Africa to China in which a dispute arose between owners and charterers. In this contract, “Good Weather Conditions” were defined as “wind speeds of maximum Beaufort force 4 (11-16 knots) and total combined (sea and swell) significant wave height confined to limits of Douglas Sea State 3 (0.5 – 1.25 meters) with no adverse currents and no influence of swell”. Vessel was ordered to sail at the Speed of about 12.50 knots with a daily consumption of about 46 MT IFO and 0.2 MT MDO.

At the end of the passage Charterers presented a performance report prepared by their Weather Routing Company, which claimed that vessel had severely underperformed during the passage. The results showed that vessel had lost over 130 hours enroute and overconsumed more than 230 MT of IFO of her maximum allowance. Owners fully rejected the claim stating that vessel had not encountered any “Good Weather Conditions” during the passage as those were defined on Charter Party. The main dispute between the two parties was regarding the interpretation of “total-combined (sea and swell) significant wave height confined to limits of Douglas Sea State 3 (0.5 – 1.25 meters) with no adverse currents and no influence of swell” and therefore it was referred to arbitration.


On the one hand, charterers’ weather routing company based its evaluation on a previous London Arbitration award (reported in LMLN 826 (London Arbitration 4/11, (2011) 826 LMLN 2), which when explaining the definition of good weather regarding Douglas Sea State 3, considered 2 meters swell to be within the limits of good weather conditions. Weather Routing Company employed by charterer also presented an article explaining that the range of wave height in the recap corresponded to a ‘significant wave height’ of 2 meters and that the word ‘significant’ was a typographical error.

On the other hand owners’ responded to charterers’ allegations that based on the wording of the agreed Charter Party, the swell height 2 meters cannot be included in the variation 0.5 – 1.25 meters as the C/P dictates. Owners also presented an expert’s report which explained that “significant wave” consists both wind wave and swell wave. Wind waves are being generated by local wind forces whereas swell waves are generated by distant phenomena, such as a storms or even a tsunami. As per expert’s report presented by owners there were two options for interpreting the clause: a) wind wave element of the significant wave height was to be limited to a maximum of 1.25 meters, b) significant wave height itself was to be limited to the same height. Either way, the report concluded that reference to Beaufort Force 4 resolved any ambiguity as such wind would generate a Douglas Sea State 3 wind wave. Therefore, under the terms of this Charter Party significant wave height was to be limited at 1.25 meters.

Owners also objected on the fact that charterer’s Weather Routing Company had deducted Good Weather current factor from vessel’s speed and as there was no relevant wording in Charter Party clause, same should not be considered in evaluating vessel’s performance. Furthermore, According to owners, charterers Analysis has also taken into account days with adverse swell, when such days were to be considered bad weather days.
Finally, the owners contended that the vessel’s logs reported weather conditions were not taken into account, while showing way worse weather conditions than those in charterers’ Weather Report and that even weather conditions by charterer’s weather routing company were to be considered, one day was not sufficient to evaluate vessel’s performance in good weather periods.

As a response to owners’ arguments, charterers claimed that since the vessel was to sail through Indian Ocean and South China Sea during monsoon season the performance warranties by adopting owner’s view of Douglas Sea State 3 would have no significance, since combined wind driven waves and swell of a maximum height 1.25 meters were almost impossible to be encountered during this period and that their interpretation of Douglas Sea State 3 (i.e. average height of wind waves not to exceed 1.25 meters) seemed more appropriate for this case.

Charterers also used another London Arbitration (12/14 ((2014) 900 LMLN 3), where the wording of Beaufort Force 4 and Douglas Sea State 3 was interpreted as “a total sea wave with wind wave plus swell wave giving significant height 2 meters or less would be considered as a ‘good weather day’.
Although insisting on their interpretation of Douglas Sea State 3, the charterers prepared another Performance Analysis using significant wave limitation at 1.25 m and allowing for adverse currents that also showed the vessel’s speed to be significantly low. According to this analysis vessel’s “Good weather speed” was at 11.10 knots instead of about 12.5 which was the c/p warranty.

In subject case the tribunal discounted charterer’s article that interpreting Douglas Sea State 3 limitations to 2 meters, as swell in only one of the two factors that describes significant wave height. Argument supported by London Arbitration of 12/14 was also discounted as there was no way to evaluate the evidence which were used to reach that decision for interpreting Douglas Sea State 3. The allegation that word “significant” was a typographical error and the explanation of owners’ expert for Douglas Sea Stater 3 was also rejected.
Through this dispute it becomes obvious that the definition of such terminology, used to describe good weather conditions can be really challenging. This is due to the lack of a specific formula to adjust two different measures of sea conditions and to establish a relationship between wind wave height and swell wave height.
Regarding significant wave height the final decision of the tribunal was that good weather conditions are based on significant wave height no more than 1.25 meters. It is clear that the tribunal ignored all the possible interpretations by Owners and Charterers and honored the wording of the Contract which was agreed by both parties.
As for the Good Weather current factor, which was debited from vessel’s speed the tribunal favored owners and accepted the explanation that was also used in London Arbitration 12/14 that “The essential purpose of a definition of ‘good weather’ was to limit the application of the performance warranties to such condition of wind and sea in which the vessel could realistically be expected to perform to her description. Where there was mention of currents, the intention was to ensure the vessel’s performance […] not impeded by them.”
Last but not least, considering the evidence that should be taken into account for evaluating vessel’s performance and since there was no relevant guidance in the charter party, the tribunal made a ruling according to the view of arbitrators in London and therefore they considered that the vessel’s logs to be preferred unless there is evidence, which shows that those reports have been falsified or exaggerated.

As a result and by considering all the decisions of the tribunal for this case, according to vessel’s logs and charterers’ report there were days with significant wave height not exceeding 1.25 meters, no adverse current and no swell. Therefore there were not any “Good weather days” to be evaluated. In this respect, charterers’ claim was fully rejected and as there was no overconsumption and no time lost, the owners were entitled to the balance of hire with interest and costs.


Authors

Lydia Mavropoulou & Hara Vlahouli

tropical-weather

Tropical Cyclones

TROPICAL CYCLONES


A tropical cyclone is a rotating, organized system of clouds and thunderstorms and has a closed low-level circulation. It originates over tropical or subtropical waters and rotates counterclockwise in the Northern Hemisphere (N.H) and clockwise in the Southern Hemisphere (S.H.).

Tropical cyclones are classified as follows:

– Tropical Depression: A tropical cyclone with maximum sustained winds of 38 mph (33 knots) or less.

Tropical Storm: A tropical cyclone with maximum sustained winds of 39 to 73 mph (34 to 63 knots).

– Hurricane: A tropical cyclone with maximum sustained winds of 74 mph (64 knots) or higher. In the western North Pacific, hurricanes are called typhoons; similar storms in the Indian Ocean and South Pacific Ocean are called cyclones.

– Major Hurricane: A tropical cyclone with maximum sustained winds of 111 mph (96 knots) or higher, corresponding to a Category 3, 4 or 5 on the Saffir-Simpson Hurricane Wind Scale.

According to the Saffir-Simpson Hurricane Wind Scale in use in the Caribbean Sea, the Gulf of Mexico, the North Atlantic Ocean and the eastern and central North Pacific Ocean, the hurricane strength varies from Category 1 to 5:

– Category 1 hurricane is referring to the hurricane with maximum sustained wind speeds of 119-153 km/h.

– Category 2 hurricane is referring to the hurricane with maximum sustained wind speeds of 154-177 km/h.

– Category 3 hurricane is referring to the hurricane with maximum sustained wind speeds of 178-209 km/h.

– Category 4 hurricane is referring to the hurricane with maximum sustained wind speeds of 210-249 km/h.

– Category 5 hurricane is referring to the hurricane with maximum sustained wind speeds exceeding 249 km/h.

                                                               Tropical cyclone formation regions

Most of the tropical cyclones usually form between 5 and 30 degrees N and generally move towards the west. Sometimes the winds in the middle and upper levels of the atmosphere change and steer the cyclone towards the north and the northwest. When tropical cyclones reach latitudes near 30 degrees N, they often move northeast.

The tropical cyclone draws its energy from the tropical ocean where it develops. It has a low pressure center and clouds circling towards the eyewall surrounding the ‘eye’. The ‘eye’ is the central part of the system where the weather is usually calm and cloud-free. Its diameter is about 200-500km but can extend to 1000km. If the tropical cyclone is of a certain strength and above, it usually takes a name in the interests of public safety.

As mentioned before tropical cyclone is also called typhoon, hurricane or just cyclone. This depends on the location it forms. More specifically:

– In the Caribbean Sea, the Gulf of Mexico, the North Atlantic Ocean and the eastern and central North Pacific Ocean, such a weather phenomenon is called “hurricane”

– In the western North Pacific, it is called “typhoon”

– In the Bay of Bengal and Arabian Sea, it is called “cyclone”

– In western South Pacific and southeast India Ocean, it is called “severe tropical cyclone”

– In the southwest India Ocean, it is called “tropical cyclone”

Tropical cyclones can cause significant impacts on life and property such as storm surge, torrential floods, extreme winds, tornadoes and lighting. Winds generated from tropical cyclones may reach speeds in excess of 300 km/h. The combination of wind-driven waves and the low pressure of the cyclone can create a coastal storm surge. Storm surge is a huge volume of water driven towards the shore at high speed and with such force that can demolish structures in its path and induce a general quite significant damage to the coastal environment.

The impact of a tropical cyclone and the expected damage does not depend just on wind speed, but also on factors such as the moving speed, duration of strong wind and accumulated rainfall during and after landfall, sudden change of moving direction and intensity, the structure (e.g. size and intensity) of the tropical cyclone, as well as human response to tropical cyclone disasters.

TROPICAL CYCLONE NAMING

The World Meteorological Association assigns names to storms whose wind speeds exceed 39 mph (63 km/h) – that’s the threshold at which a cyclone is considered a tropical storm. WMO maintains rotating lists of names which are appropriate for each tropical cyclone basin. If a cyclone is particularly deadly or costly, the name used is retired and replaced by another one. As there can be more than one tropical cyclone in a region and at the same time lasting for a week or more, weather forecasters started giving names to each one of them to avoid confusion. The names given are in alphabetical order (e.g. with ‘A’ starts the first cyclone of the year) and they are alternated between women and men’s. The name list is proposed by the National Meteorological and Hydrological Services (NMHSs) of WMO Members of a specific region, and approved by the respective tropical cyclone regional bodies at their annual/bi-annual sessions. Six lists are used in rotation. Thus, the 2019 list will be used again in 2025. The only time that there is a change in the list is if a storm is so deadly or costly that the future use of its name on a different storm would be inappropriate for reasons of sensitivity. If that occurs, then at an annual meeting by the WMO Tropical Cyclone Committees, the offending name is taken out from the list and another name is selected to replace it. Infamous storm names such as Mangkhut (Philippines, 2018), Irma and Maria (Caribbean, 2017), Haiyan (Philippines, 2013), Sandy (USA, 2012), Katrina (USA, 2005), Mitch (Honduras, 1998) and Tracy (Darwin, 1974) are examples for this.

The names given should be familiar to the people living in each particular tropical cyclone basin. Obviously, the main purpose of naming a tropical cyclone/hurricane is basically for people easily to understand and remember the phenomenon and thus to facilitate tropical disaster risk awareness, preparedness, management and reduction.


NOTABLE TROPICAL CYCLONES

Most of the tropical cyclones leave behind widespread devastation both in peoples’ lives as well as financially. This has led lots of people question whether climate change is increasing the frequency and intensity of such phenomena. Most scientific models predict future decreases in the quantity of global cyclones however, increases are projected in the intensity of the strongest cyclones. The Category 4 and 5 may increase by 0-25% with an associated increase in rainfall. Sea level rise due to climate change will contribute to the increase of the storm surge events induced by cyclones. Storm surge flooding is highly likely with global warming so coastal regions where the cyclones occur remain vulnerable.

Below, there is a list of some of the most notable tropical cyclones recorded to remind us the need for improved impact-based multi-hazard early warning systems, mitigation measures and well prepared staff at risk to take quick effective action to save lives.


– Hurricane Harvey (2017) was the wettest hurricane to hit the USA with an observing station in Texas recording over 64″ (1640 mm) rain.

– Patricia (2015) was a Category 5 hurricane in the eastern North Pacific with 1-minute average winds of 215 m.p.h. and a central pressure of 872 mb. It was the strongest recorded tropical cyclone in the western hemisphere.

– Cyclone Pam (2015) was one of the most intense southern hemisphere cyclones recorded with an estimated central pressure of 896 mb. It caused much destruction and loss of life as it passed through the islands of Vanuatu in the South Pacific.

– Typhoon Haiyan (2013) was a category 5 typhoon with 1-minute average winds of 195 m.p.h. It hit the central Philippines.

– Sandy (2012) was the second most costly hurricane on record, after Katrina, causing $71 billion in damage on the eastern seaboard of the USA.

– Katrina (2005) caused an estimated 1500 deaths and it was the most costly hurricane on record causing an estimated $108 billion in damage in Louisiana and Mississippi.

– Hurricane Wilma in 2005 was the most intense hurricane recorded in the North Atlantic, with an estimated central pressure of 882 mb.


The most deadly tropical cyclone ever recorded hit Bangladesh in 1970 killing approximately 300,000 people as a result of the storm surge.


Author: Triantafyllia Sideri / Operational Meteorologist

graphics-To_IMS-NAOglobes

Oceanic-Atmospheric Oscillations

OCEANIC-ATMOSPHERIC OSCILLATIONS


EL NINO SOUTHERN OSCILLATION (ENSO)

El Nino and La Nina are the opposite phases of what is called El Nino-Southern Oscillation cycle. El Nino is the warm phase of ENSO and La Nina the cold phase of ENSO. ENSO describes the fluctuations in temperature between the ocean and atmosphere in the east-central equatorial Pacific. ENSO usually occurs every 2-7 years and can have a huge impact, not only on ocean processes but also on global weather patterns. When El Nino and La Nina take place, typically last 9-12 months but El Nino appears more frequently than La Nina.


During normal conditions or ENSO-neutral year, a low pressure system lies over northern Australia and Indonesia and high pressure on the other side of the Pacific over Peru. Simultaneously, the trade winds blow steadily from east to west pushing warm surface waters from east to west Pacific causing cold and nutrient-rich bottom water moving up off the coast of S. America.

Typical winter impacts associated with ENSO neutral events. Colder probabilities are favored across north-central and northeast portions of the US, due to a polar jet stream shifted further south. Meanwhile, warmer probabilities are favored across the southern US, with above normal precipitation favored across portions of the southeast US.  Image courtesy of Ray Wolf, National Weather Serivce.


El Nino means ‘little boy’ in Spanish given by Peruvian fishermen when more than 100 years ago noticed changes in anchovy populations around Christmas time due to extraordinary warm surface waters in the eastern tropical Pacific ocean.

Normally the Peru (Humboldt) Current brings cold water from the Southern Ocean northwards along the west coast of South America. Along the coast of Peru this water is enhanced by up-welling, due to trade winds, which positively affects the sea life of the area. Under the influence of the equatorial trade winds, this cold water moves west along the equator where it is slowly heated by the sun. Thus sea surface temperatures(SSTs) in western Pacific are generally warmer by 8-10oC than those in eastern Pacific.

In an El Nino year, the low pressure system over west Pacific weakens and so diminishes or reverses the trade winds to transport warm surface water towards South America. This reduces the upwelling near the coast which further diminishes high pressure over Peru and even further the trade winds.

During El Nino years the water in eastern Pacific becomes as warm as the western Pacific.

Its climate impacts show up mostly in wintertime over N. America. The warmer ocean fuels an intensification and southward shift of the jet stream. This brings flooding to the southern United States and warmer, drier conditions over parts of the NW Pacific, northern US and Canada.


On the other hand, La Nina means ‘little girl’ in Spanish and it is the reverse of El Nino. This time, the eastern tropical Pacific waters are colder than normal. During La Nina event, the trade winds become stronger than normal, blowing more warm water to the west, leaving more room in the area of eastern pacific for cold upwelling. These unusually cold conditions in the tropical Pacific displace the jet stream northwards. In places where it is exceptionally cool and wet during El Nino, it is generally hot and dry during La Nina. La Nina can lead to draught in the southern US and cooler temperatures, heavy rain and flooding in the Pacific NW. La Nina conditions are also associated with an increasing number of tropical storms in the Atlantic Ocean, whereas El Nino brings more severe tropical storms to the Pacific.

El Nino and La Nina together are part of a cycle that influences extreme weather and can impact food production, water supply and even human health not just in the US but in many parts of the globe. The cycle of ENSO is not a regular oscillation like the season change but it is much more erratic in strength, timing and pattern. However, it generally occurs every 2-7 years as mentioned before.


NORTH ATLANTIC OSCILLATION (NAO)


The North Atlantic Oscillation (NAO) is one of the most prominent teleconnection patterns affecting the weather systems in the northern hemisphere. The NAO index is based on the surface sea-level pressure difference between Azores high and Icelandic low. It shows considerable interseasonal and interannual variability and prolonged periods of several months of both positive and negative phases of the pattern are common. The positive phase of NAO reflects below-normal heights and pressure across the high latitudes of the N. Atlantic and above normal heights and pressure over the central N Atlantic, eastern US and W Europe.  The negative phase reflects the opposite pattern over these regions. Both phases of the NAO are associated with changes in location and intensity of the North Atlantic jet stream and consequently the storm track. The periodic change of NAO affects the strength of the prevailing winds in the N hemisphere, the westerlies, and therefore the weather patterns. These wind variations affect in turn the strength and direction of ocean surface currents in N Atlantic. Positive NAO indicates high pressure over Azores and an intense low over Iceland resulting in stronger winds. Strong positive NAO indicates above average temperatures in eastern US and across N Europe and below average temperatures in Greenland and often across southern Europe and Middle East. Additionally, there is above average precipitation over northern Europe and Scandinavia in winter and below average precipitation over southern and central Europe. Opposite temperature and precipitation patterns are observed during strong negative NAO. During particular prolonged periods dominated by one particular NAO phase, anomalous height and temperature patterns can also be extended well into central Russia and north-central Siberia.


ARCTIC OSCILLATION (AO)


The Arctic circulation is a climate pattern characterized by winds spinning counterclockwise around the Arctic at about 55oN latitude. The intensity of atmospheric pressure difference between the North Pole and middle northern latitudes create the positive and the negative phase of the AO. When AO is positive (warm), strong winds circulating around the North Pole confine colder air across polar regions. This results in mild winter weather being experienced by much of the US and N Europe but drought conditions being established over the Mediterranean. This belt of winds becomes weaker and more distorted when AO is in its negative phase, meaning higher than normal atmospheric pressure lies over the Arctic region and lower than normal pressure over the central Atlantic Ocean. This situation allows an easier southward penetration of colder, arctic airmasses along with increased storminess into the mid-latitudes due to the weaker westerlies derived from the pressure difference. During the negative (cool) phase, much of the US, N Europe and Asia experience cold and stormy winters. More storms also develop over the Mediterranean region.

The AO and NAO are collectively referred to as the Northern Annular Mode (NAM).


ANTARCTIC OSCILLATION (AAO)


The Antarctic Oscillation (AAO) is a measure of the pressure gradient between the polar and subpolar regions of the Southern Hemisphere. It describes the north–south movement of the westerly wind belt that circles Antarctica, dominating the middle to higher latitudes of the southern hemisphere. AAO is also known as Southern Annular Mode (SAM) and it is the opposite pattern of NAM. The changing position of the westerly wind belt affects the position of cold fronts and storm systems in mid latitudes which in turn affects the rainfall variability in southern Australia. When AAO is in its positive phase, the belt of westerly winds contracts towards Antarctica. This leads to weaker westerlies than normal and higher pressures over southern Australia, a combination of which restricts the penetration of cold fronts inland. During autumn and winter, positive values of AAO mean cold fronts are further south and thus southern Australia misses lots of the rain. However in spring and summer, a strong positive AAO means that southern Australia is affected by the northern half of high pressure systems and therefore there are more easterlies bringing moist air from Tasman Sea. This moisture can fall as rain when winds hit the coast. When AAO is in its negative phase, the belt of strong westerly winds expands towards the equator. This shift in the westerlies result in more (or stronger) storms as low pressure systems cross the southern Australia.


MADDEN-JULIAN OSCILLATION (MJO)


The Madden-Julian-Oscillation (MJO) is an eastward moving disturbance of clouds, rainfall, winds and pressure that crosses the planet in the tropics and returns to its initial point in 30-60 days on average. Unlike ENSO which is stationary, this moving disturbance is associated with persistent weather situations which last several seasons or longer over the Pacific. There can be multiple MJO events within a season and thus MJO is described as intraseasonal tropical climate variability (can vary on a week to week basis). It was named after Roland Madden and Paul Julian who first described it when they noticed regular oscillations in winds between Singapore and Canton Island in the west central equatorial Pacific. It is the main oscillation behind weather variations in the tropics and subtropics.

How does the MJO work?

An area of enhanced tropical rainfall is first apparent over the western Indian Ocean. This area spreads eastwards into the warm waters of the tropical Pacific. This pattern of tropical rainfall tends to lose intensity as it crosses the cooler waters of the eastern Pacific before reappears at some point over the Indian Ocean again. A wet phase of enhanced convection (rainfall) is followed by a dry phase, where thunderstorm activity is suppressed (no rainfall). Each cycle lasts circa 30-60 days as mentioned earlier.

MJO influences the global weather in a number of ways:

– It affects the intensity and break periods of the Asian and Australian monsoons. The enhanced rainfall phase of MJO can bring the onset of the monsoon season around the globe whereas the suppressed rainfall phase can delay the onset of the monsoon season.

– MJO also interacts with the southern oscillation, contributing to the speed of development and intensity of an El Nino or La Nina event. MJO appears to be more active during neutral and weak ENSO years.

– MJO creates favourable conditions for tropical cyclone activity and this makes MJO important to monitor during the Atlantic hurricane season.

–  There is also evidence to suggest that MJO influences the onset of a sudden stratospheric warming (SSW) event.


Author: Triantafyllia Sideri / Operational Meteorologist

6d1a56d0f7d383e4155a090b505f3bc9

Stable VS Unstable atmosphere

COASTAL FOG OR HAAR

Generally, fog forms when the water vapor condenses into water droplets consisting a low-lying cloud. This low-lying cloud can produce slight precipitation, like light drizzle or light snow. Visibilities within fog fall below 1000m.

Fog consists of various types depending on the process that the cooling took place to induce the condensation of the water vapor. Some of the fog types are:

– Radiation fog

– Hill fog

– Frontal fog

– Advection fog

The coastal sea fog belongs to the latter type; the advection fog.

How does Haar then form?

Haar is the Scottish name that is used for the coastal fog that forms over the North Sea during this period indicating the start of summer.

Vessels that travel the North Sea in the summer months should have encountered this type of fog. It starts from the sea but it can easily penetrate into the port and further in land.

East of the United Kingdom is the North Sea. North Sea is a relatively cold sea.

During the summer months, and when southeasterly winds blow, warm and moist air from the continent passes over the cold North Sea. The cold air then over the sea cools the warm air above it so the warm air cannot hold its moisture any more and condenses to cloud which is the fog we see.

Haar usually takes place during spring and summer months when air starts to warm up but the sea stays relatively cold. In the pictures below, it’s the Haar ‘live’ at the Aberdeen beach.


There are occasions when Haar can penetrate from near the coast to further inland and then the whole city can be covered by a fog blanket.

There are a few conditions that need to be met in order to have the Haar spreading into the city. These are:

– Wind speed and direction

– Land surface temperature

When moderate (around 15kts) easterly winds prevail, then the sea fog can spread into the land. However, if the land surface temperature is high, fog can disperse before it penetrates a lot into the city as the air warms up. On the other hand when the land temperature is low, fog can move further into land to cover the city. The latter usually takes place after sunset when the land surface cools down. This is the time when we actually see the Haar out of our windows. During the day it stays over the sea near the coast, as sea is cooler than the land, but after sunset it reverses and Haar moves towards the land as now land is cooler than the sea!


In the picture on the left, it’s the Haar coming from the sea towards the city and in the picture on the right it’s actually the Haar now covering the buildings.

All types of fog consist a stable layer through the atmosphere whereas showers and thunderstorms that can also happen quite often during summer months consist on the other hand a more unstable atmospheric situation. Additionally, fog starts over the sea in summer whereas thunderstorms start over the land. They are usually associated with huge cumulonimbus clouds in rapid development.


CUMULONIMBUS : ‘THE CLOUD KING’


I am sure all of us wonder sometimes what type of clouds are in the sky. We are asking questions like: ‘Will they bring rain or not?’, ‘Will they disperse soon for the sun to come out again or not?’, ‘Will it start to become dark and windy?’ etc. However, the answers to these questions vary and highly depend on the type of clouds we have in the sky.

There are different and quite numerous types of clouds and of course not all of them bring rain/snow/hail. The most fascinating cloud to talk about and at the same type the most dangerous one is the Cumulonimbus (CB) cloud. Meteorologists usually refer to this cloud as the ‘cloud king’! I am pretty certain that you’ve heard about this cloud before but you weren’t sure of why this is so dangerous and what weather conditions is associated with.

Let’s try to understand its role to our weather when it appears on the sky and why it is called a ‘Cloud King’.

Firstly, the world Cumulonimbus stems from two Latin words. One is cumulus (means ‘heap’) and the other one is nimbus (means ‘rainstorm’).

Cumulonimbus clouds start to form when convection takes place in the atmosphere. This is the forced upward motion when hotter and so less dense air lies above the ground.

The first clouds that start to form are the Cumulus clouds which can grow and expand even more to form eventually the CBs.  CBs are massive and huge vertical clouds which store energy similar to the energy of 10 Hiroshima-sized atom bombs!

They can be seen either alone or in clusters. Cloud bases range between 200-4000m with tops up to 12000m and in extreme occasions of around 20000m or more.

They are associated with severe weather such as torrential downpours, hail, lightning and thunderstorms. Individual CB cells last for about one hour and then dissipate with the rain produced characterised as short-lived. However, multi-cell storms hold lots of CB clouds so intense rainfall is expected to fall for much longer.


DRY THUNDERSTORMS

We’ve discussed before that thunderstorms and lightning are associated with CBs and we also know that they usually come together with heavy rain.

There are some occasions, though, when we can have huge CBs and lightning but with no rain reaching the ground. This thunderstorm is known as a dry thunderstorm.

Dry thunderstorms usually occur in places where there have been dry conditions for a while during hot summer months.  As the air is very hot and dry, the falling water from the CB evaporates before it reaches the ground. The lightning, however, can reach the ground and this can cause severe wildfires. Additionally, strong gusty winds that occur nearby the CBs can intensify the flames causing the firestorm to spread more quickly.

Southern European countries are prone to forest fires during dry summer months and this is what happened to Portugal in summer 2017 where the temperatures were around 400C.

Fire started in a wooded region 150km northeast of Lisbon and the result was the death of at least 60 people, most of them trapped in their cars. The Prime Minister of Portugal called it the ‘biggest tragedy of human life that we have known’.

The satellite image above shows the smoke of the massive fire spreading into Spain as well.

 Below you can find a couple of pictures from the news about this tragedy:


HEATWAVE

As temperature picks up in Greece this week and is expected to reach 37-38 degrees Celsius over the weekend while it is still May, it’s good to define the term ‘heatwave’ as it will be referred in the news quite a lot these days.

 So, how do we define a heatwave?

Heatwave is a period of abnormally hot weather compared to the expected weather of the area at that time of year. It is also usually associated with high humidity.

To be precise, according to WMO’s definition a heatwave is ‘when the daily max temperature of more than five consecutive days exceeds the average max temperature by 5 degrees, the normal period being 1961-1990’.  Not all warm weather we experience is a heatwave. The key is under the words ‘more than five days’.

Heatwaves are common in summer for both hemispheres when high pressure systems (anticyclones) develop over an area. High pressure systems are associated with dry and settled conditions and are usually slow moving. Thus, they can persist over an area for days or weeks resulting in prolonged dry and warm conditions.


Author: Triantafyllia Sideri / Operational Meteorologist

yb9oZw

Currents and Waves

OCEAN CURRENTS AND WAVES


CURRENTS

Ocean currents are streams of water flowing both near surface but also far below it. Horizontal movements are called currents while vertical movements are called upwellings/downwellings. Surface currents are created by prevailing winds which blow over the ocean pushing the water along. As winds pushing the water away, deep cold currents rise to take its place. This upwelling of deep, cold water moves nutrients from ocean’s bottom to the surface resulting in nourished food for fish. This happens due to differences in seawater density. Water’s density depends on its temperature and salinity. The colder and saltier the water is, the denser and heavier it becomes. Cold and dense water then sinks and flows under warmer, lighter water creating a current. The Earth’s rotation from west to east cause ocean currents to veer right in the northern hemisphere (N.H.) and left in the southern hemisphere (S.H.). This deflection, known as Coriolis effect, makes surface currents flow clockwise in a circular pattern in the N.H. and anticlockwise in the S.H.


The world’s large ocean currents are also influenced by the prevailing winds. Warm ocean currents are red, and cold currents are shown in blue.


FAMOUS WORLDWIDE OCEAN CURRENTS

Gulf Stream is one of the most famous ocean currents in the world. This current is warm and flows from Gulf of Mexico up to eastern coast of US and Canada before spreading to the Atlantic Ocean heading northwards. Gulf Stream is enormous and very powerful. It measures up to 80km in width and it is more than 1km deep. Due to the strength of Gulf Stream , northern Europe is also inhabitable even though it is close to the Arctic. Countries like Great Britain, Scandinavia and Russia would have been icy cold if Gulf Stream was absent. Consequently, Gulf Stream plays a major role in climate.


The Antarctic Circumpolar Current (ACC) is the largest ocean current in the globe. It starts from the Antarctic and flows eastward towards south Atlantic, Indian and Pacific Oceans. The ACC is a relatively slow current but transports greater amounts of water than any other current. As the deep and cold water travels through warmer climates, it mixes with warmer water. As the cold water sinks below, the warm water rises creating a slow upwelling bringing nutrients to the surface as mentioned before. Westerly winds are very strong in the Antarctic which drive the eastward flow of the ACC. Due to this, the ACC is historically referred to as the ‘West Wind Drift’.


Other known, important but smaller currents are: Kuroshio current, Peru (Humboldt) current, California and Labrador current.


Kuroshio current or Japan current is similar to Gulf Stream but in the Pacific Ocean. It is fast, relatively deep and narrow. It transfers warm tropical water northwards towards the polar region. The warm waters of Kuroshio current are vital for the coral reefs of Japan which are the northernmost coral reefs in the world.


Peru current or Humbolt current is a relatively slow and shallow current of the southeast Pacific. It is reinforced by the West Wind Drift and it is a cold current apart from the times when El Nino takes place. Peru Current brings coastal fog but it also brings moisture to one of the most arid regions in the world. The cold flow is intensified by upwelling of deep water full in nutrients which in combination with the sun, allows rich plankton to grow. This is why Peru, Chile and Equador coasts are famous for their fishing grounds for anchovies and tuna.


The California current flows southward along the west coast of North America. It is considered as a major current associated with strong upwelling zones supporting abundant plankton and animal life. California Current is a continuation of the Kuroshio current from Japan which causes an outland transport of cool water from high latitudes along the California coast to make this area highly productive.


The Labrador current is cold in the North Atlantic and flows southwards along the western side of the Labrador Sea. The current passes along the eastern coasts of Canada. It carries a significant amount of water but also numerous icebergs southwards. Labrador current was responsible for carrying the famous iceberg which led to Titanic’s shipwreck in 1912. Additionally, the cold Labrador current can create ship navigational problems as in the regions where the cold current meets the warm from the Gulf, fog forms and can be quite thick. On the other hand, Labrador Current is quite important as its cold waters (<0oC) and its low salinity support the diversity of sea life including the famous Atlantic Cod and American plaice.


Europe is mostly affected by Gulf Stream and Labrador Current. Climate change could reduce the flow of both Gulf Stream and Labrador Current leading to a diversion towards NW Atlantic. This diversion could lead to colder climates for northern Europe and milder winters in Canada’s eastern coastal areas. However, the melting of Arctic ice will load more waters to Labrador Current making it slower and at the same time threatening due to the sea level rise.

The above mentioned currents are some of the most significant ones globally. Of course there are loads of currents and a list of them can be found below:


List of Ocean Currents of the World

Name of Current Nature of Current
North Equatorial Current Hot or Warm
Kuroshio Current Warm
North Pacific Current Warm
Alaskan Current Warm
Counter Equatorial Current Warm
El Nino Current Warm
Tsushima Current Warm
South Equatorial Current Warm
East Australian Current Warm
Humboldt or Peruvian Current Cold
Kuril or Oya shio Current Cold
California Current Cold
Antarctica Current Cold
Okhotsk Current Cold
Florida Current Warm
Gulf Stream Warm
Norwegian Current Warm
Irminger Current Warm
Rannell Current Warm
Antilles Current Warm
Brazilian Current Warm
Labrador Current Cold
Canary Current Cold
Eastern Greenland Current Cold
Benguela Current Cold
Antarctica Current Cold
Falkland Current Cold
Mozambique Current Warm and Stable
Agulhas Current Warm and Stable
South-West Monsoon Current Warm and unstable
North-East Monsoon Current Cold and unstable
Somali Current Cold and unstable
Western Australian Current Cold and Stable
South Indian Ocean Current Cold


WAVES

A wave is a ridge on the water surface and it usually has a forward motion. However, inside the waves the water mass moves in a circular motion and it’s only the wave energy that moves forward. There are several types of waves but on this chapter we will talk about wind waves, swells and rogue waves.


WIND WAVES

When wind blows over a water surface, waves can be created. However, wave height depends on wind speed, duration (how long the wind blows) and fetch. Fetch is the distance over water that wind blows in a single direction across the surface without disruption from obstacles. For big waves to form we need to have a combination of all three factors like great wind speed, long duration and big fetch. If the wind duration and fetch are long enough, the sea becomes ‘fully developed’ and reaches a steady state. The waves have then reached a maximum size for that wind speed. In deep water, particles move in a circular motion when the waves pass. The greater the depth, less the movement of water which becomes very small at depths more than half the wave length.

Waves at sea are usually a combination of several wave systems that have waves of different length and height. The wave height is calculated by measuring the average of the wave height of the top third of the waves – which means we need to measure all the wave heights to find out the ones that are in the highest 33%. This wave height is called significant wave height and is used in nautical meteorology forecasting.

However, the tallest waves could reach 1.6-1.8 times the significant wave height and individual waves can reach twice the significant wave height.

When the wind dies out, it usually takes 5 hours till the last large wave has passed and 10 hours before waves with height as same as the significant height have passed.

When at sea, and you see waves starting to increase, windy weather is on its way!


SWELLS

Swells are the waves that are produced by far away storms (raging hundreds of miles out to sea) and combined with the wind waves can give high wave heights. Of course they can also appear suddenly on a calm sea. Like we mentioned before, the longer the fetch, the stronger the wind and the longer the wind duration, then the further away the swell can travel.

Near storms and deep low pressure systems, the vigorous air movement lead to strong to gale force winds. As wind blows over the sea surface, friction takes place and energy is transferred from wind to water resulting in a rising wave crest. As time passes, a large amount of energy can be built below ocean’s surface resulting in deeper and higher waves. This energy gives power to swells so they can travel long distances over the ocean. As swells move away from their primary region, they become rounded and flatten. There are variations in the height of each swell. Swell height is usually the average height of the tallest one third of waves in a swell collection. Like the wind waves, swell direction is the direction where the swell is coming from. A collection of ocean swells can move in any direction over the ocean and this can of course be different to the wind direction of the region.


ROGUE WAVES

A rogue wave or freak wave is the highest and most dangerous wave that can be encountered at sea. It is two times higher than the significant wave height. Thus, a rogue wave is a lot bigger than the other waves happening at the same time. Rogue waves can form anywhere but they can be seen more often in the Atlantic, North Sea and even more frequently off the southeast coast of South Africa. The biggest wave observed is 30m. Obviously, rogue waves are considered rare but pretty dangerous causing significant harm to big oceangoing vessels.


They can mainly form when a swell interacts with the current in the area. One typical example is in the southeast Africa when large ocean swells can meet with the fast-moving Agulhas current. The current can intensify wave’s energy, making the wave more powerful.  Rogue waves can also form from eddies. Eddies are generated along the edges of currents that flow in a different direction than the main current. Eddies can travel for long time across the oceans being organized into eddy fields. These eddy fields have much more kinetic energy than the currents themselves. In the immediate vicinity of currents where eddies are present, rogue waves can form.


Author: Triantafyllia Sideri / Operational Meteorologist

2l-image-211

Wind types and sailing

WIND TYPES AND SAILING

The movement of air is called wind and is created due to uneven heating of the Earth from the sun. These differences in temperature create differences in the atmospheric pressure which then generate the wind flow. Winds generally blow from high pressure areas to low pressure areas.

Winds that blow over the Earth’s surface may be classified into five main categories:

Types of wind:

1) Planetary or prevailing winds

   a) Trade winds, b) Polar easterlies, c) Westerlies

2) Periodic winds (e.g. monsoons, sea breeze)

3) Local winds (e.g. etesians or meltemia)


PLANETARY / PREVAILING WINDS

The sun heats differently the Earth’s surface as mentioned earlier. The sun rays heat the poles in a more slanted angle than they heat the equator. Equator then becomes hotter than the poles and air masses rise (leading to low pressure) at the equator whereas air masses sink above the poles as they are colder(leading to high pressure). This difference in pressure leads to global wind circulation as cold polar air moves south to replace the equatorial rising warm air. However, this circulation becomes more complicated due to Earth’s rotation and associated Coriolis effect. The Coriolis effect means that air does not flow from high to low pressure directly but it is deflected to the right in the N. hemisphere and to the left in the S. hemisphere.

These complicated wind circulations lead to three different stable wind zones or cells forming across the Earth.


a) Trade winds

Trade winds are northeasterly winds in the tropics for the northern hemisphere and southeasterly winds for the southern hemisphere. The transfer of solar energy is more evident north and south of the equator at what is called ‘Hadley cell’.  At the equator the hot air contains quite huge amount of water vapor and as it rises through higher latitudes, it forms clouds and subsequently precipitation. This is why in the tropics we see lots of rain. As the air rises further it cools down and becomes dry and dense. This results in air sinking at around 300 N and S respectively creating a high pressure area. The sinking air towards the equator is what we call trade winds which due to Coriolis effect it blows from a northeasterly direction in the N. hemisphere.

The trade winds from both hemispheres converge at the intertropical convergence zone (ITCZ) located at 00 latitude. When the trade winds converge, the air rises to form clouds.

Trade winds are generally very predictable. They are associated with the history of trade. Ships relied on trade winds to establish quick and reliable routes across the Atlantic and Pacific Oceans. Even today, shipping depends on trade winds and the ocean currents they drive.


b) Polar easterlies

Near the poles, each airmass creates a region of high pressure. As the polar air is cold, it sinks so it moves towards the equator. This air blows from the northeast to the southwest. These winds are called polar easterlies.

As the polar easterlies move towards the equator, they warm up and become less dense. This leads, at about 60O N, part of this air to rise back towards the North Pole at high altitude creating an area of low pressure. This circulation is called the polar cell. Similar to the Hadley cell, the wind circulation is driven due to the pressure difference between the pole and the 60o N latitude.


c) Westerlies

The westerlies are the prevailing winds at mid latitudes which occur at the Ferrel or Mid-latitude cell. This is between 30o N and 60oN and 30o S and 60oS respectively. The Ferrel cell is between Hadley and polar cell and can be referred as an atmospheric gear between these two cells.

At 60oN (the southern boundary of polar cell) the warm air rises. The cool air at 30o N (the northern boundary of Hadley cell) sinks. Part of the air at the boundaries continue its way and another part returns back to where it started.  In the northern hemisphere the surface winds at the Ferrel cell blow from the southwest to the northeast and in the southern hemisphere from the northwest to the southeast and that’s the reason why they are called prevailing westerlies.

The westerlies of the Southern hemisphere, though, are stronger and more constant than the westerlies of the Northern hemisphere.

The westerlies make a significant impact on ocean currents, especially in the southern hemisphere. The strong Antarctic Circumpolar Current (ACC or West Wind Drift) is driven by the westerlies and can travel around the continent (from west to east) at about 4kph (2.5mph).

The ACC is the largest ocean current in the world and extremely significant for carrying volumes of cold water and nutrients to the ocean leading to healthy marine ecosystems.


The global atmospheric circulation looks simple but it is not. It is actually more complex than the three-model cell as it depends on water-land heating/cooling variations in both hemispheres. The water and land areas in northern and southern hemisphere are different and the low/high pressure systems change dramatically with the seasons. This has an impact in global circulation and subsequently in forecasting.

The above infrared (IR) image from METEOSAT shows how the global cloud patterns are formed by the prevailing winds. The Inter-Tropical Convergenze Zone (ITCZ) is marked by a belt of tall clouds (A) near the equator. On either side of this, are the clearer skies of the subtropics (B), and closer to the poles on each side, the region of the Westerlies (C) where cloud cover is more variable. In this thermal infrared image, cold regions are bright, and warm regions are dark.


PERIODIC WINDS

Sea breeze

During the day, when the weather is fair and calm, the land is heated up more quickly than the sea. This happens as the sea has larger heat capacity than the land and it is deeply penetrable by the solar rays. Therefore, 2-3hrs after sunrise, the land surface temperature rises and so does the air above it by the process of conduction. As the air gets warmer, it becomes less dense and rises through the atmosphere resulting in decrease in pressure over the land. The air above the sea has now higher pressure than over the land and this pressure difference creates a wind that flows from the sea towards the land.

This wind is called sea breeze.

The strength of the sea breeze increases as the temperature difference between land and sea increases during the day. Sea breeze reaches its maximum speed a couple of hours after midday when the temperature difference between land and sea is at its greatest. However, sea breeze starts to decrease later in the afternoon and ceases completely early in the evening. The direction of the sea breeze is perpendicular to the shore and the distance it can penetrate into the land varies between 20-40km from the shore. This takes place when the terrain is even and the temperature difference between land-sea is large. The height above the surface that the sea breeze can reach, is about 500m.


Monsoons

A monsoon is a seasonal change in wind direction over a region. There are two types of monsoons, winter and summer ones. They both occur once in a year and are part of the climate of Southeast Asia, Australia and southwest of N. America.

The monsoon happens due to the difference in heating between land and ocean, similar to sea breeze.

During summer the air over the land is heated more quickly than the air over the ocean. As a result, the air over the land rises creating a space for the cool and moist air from the ocean. As the land is further heated, the moist air rises, cools and condenses to clouds and falls back as rain. The summer monsoon over the affected areas is warm and moist. The most famous summer monsoon develops over the Indian Ocean bringing quite significant precipitation to areas such as India, Sri Lanka, Bangladesh and the Philippines.

On the other hand, during the winter, the opposite happens. The warm air over the ocean rises and the space is replaced by the cool air from the land. The winter monsoon over the affected areas, is cool and dry with no precipitation falling. Asia’s winter monsoons bring cool and dry air from the Himalayas instead.

Comparing the two, the summer monsoon of course is more important than the winter one as it brings water to generally arid regions. However, sometimes it can turn to a quite intense weather phenomenon resulting in floods and destructions.

Picture on the left shows a July surface weather map indicating a large low-pressure system over central Asia in blue and several adjacent high-pressure systems in red. Picture on the right shows dark monsoon clouds approaching from the sea in Kerala, southern India.


LOCAL WINDS

Etesians or Meltemia

Vessels that travel during the summer months at the Aegean Sea, they might have experienced quite high seas with gale force winds. Why and how can this happen in summer when we all expect smooth and calm waters in such a narrow and confined area?

The answer lies under the word: ‘Etesians or Meltemia’.

Meltemia are seasonal winds that blow in the Aegean Sea mainly during the summer months. They named after a turkish word (‘meltem’) which means ‘seasonal wind’. ‘Meltem’ also took its name from an italian phrase (‘Mal tempo’), which means ‘bad weather’. Ancient Greeks called these winds ‘Etesians’ deriving from the word ‘etesia’ meaning ‘annual’.

Their speed varies between 20 and 55kph. However, in the open seas their speed can exceed 75kph or the Force 8 in the beaufort scale and so they can easily become gale force winds and ships can experience rolling and pitching.

Meltemia blow from:

N or NE in the Northeastern and central Aegean Sea
NW or W in the south Aegean Sea and also in the Cretan Sea


How do they form?

During summer months hot air masses in India ascend through the atmosphere. This ascending air creates a barometric low pressure system over India which extends towards Turkey and Cyprus. On the other hand the stable barometric high pressure system over Azores extends towards Europe and particularly towards Balcans. This combination of high pressure in the northwest and low pressure in the south east leads to meltemia to be established as it can be seen in the picture below. This big difference in pressures (high in the north west, low in the south east),  can make meltemia reach really high wind speeds over the Aegean sea as mentioned earlier.


Meltemia are much more intense during the day than at night. This big difference in wind speeds between day and night, can be associated with the temperature difference between land and sea surfaces which is more apparent during the day. During daytime, sea breeze develops in coastal areas as mentioned earlier. Consequently, the sea breeze reinforces the speed of meltemia. However, during the night the temperature difference between land and sea decreases and so does the sea breeze. Then, as the sea breeze becomes less apparent in the evening, meltemia become weaker too.

So don’t be surprised when you travel across the Aegean in summer and you get caught in windy waves!

Meltemia blow every summer in the Aegean for 2500 summers now!! This type of wind is one of the most stable wind in the world!!!  However, nowadays meltemia are likely to become extinct due to climate change. This means that their duration, intensity and possibly the places they blow are due to change in the coming years!


All the above mentioned type of winds are apparent to vessels travelling around the world and of course there are more. Getting to know what winds you can expect in which area might be useful to be prepared accordingly.


Author: Triantafyllia Sideri / Operational Meteorologist


Grains

Moisture and Cargo Sweat

RELATIVE HUMIDITY, DEW POINT AND CARGO SWEAT

  • RELATIVE HUMIDITY

In order to examine the role of relative humidity to the weather and its impact to humans we need to look at how the water vapour is being produced in the atmosphere:


WATER VAPOUR AND ATMOSPHERE:

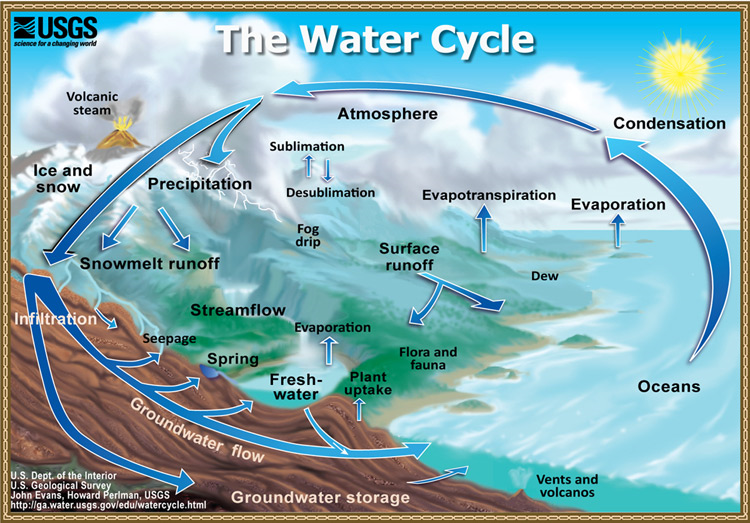
Since the beginning of this world, water has been travelling in a cycle. Water from the oceans and land is transferred to the atmosphere and all the way back again. This is how life is maintained on Earth. The trigger mechanism that forces water to travel is the solar radiation. Solar radiation makes the water from the ocean and land surfaces to evaporate. This procedure turns the water liquid to water vapour and this is how the vapour is added to the atmosphere. Additionally, water(liquid) on the land surface is absorbed by plants and with the process of transpiration, water(vapour) is added to the atmosphere. As vapour moves through the atmosphere, it is cooled and condensed so as to form the clouds. Then rain or snow falling from the clouds lead the water to return back to the Earth and the cycle starts again.


B) SO HOW DO WE DEFINE RELATIVE HUMIDITY (RH) ? :

In part A, we discussed how the water vapour can be added to the atmosphere. At any given temperature, the air can ‘hold’ a maximum amount of vapour. However, most of the times the amount of water vapour in the air is less than its maximum amount. In essence, RH is the percentage of the actual amount of water vapour divided by the maximum amount of water vapour the air could ‘hold’ at that temperature. In other words, RH measures how humid or dry the air is in the atmosphere.


A                                                 B     


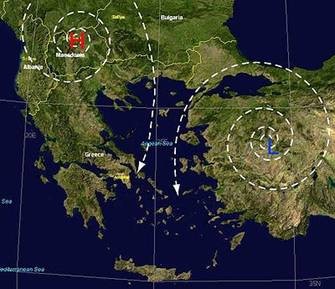
In picture A the air is foggy. When fog occurs, air has RH of 100% . On the other hand, in picture B the air is almost dry. In this case, the air has RH of around 0%.


C) HOW HUMANS FEEL THE HIGH AND LOW RHs?

 RH plays an important role on how people feel the weather. Our bodies usually remove extra heat by sweating. The process of sweating helps the body to stay cool and maintain its current temperature. High RHs reduce the amount of water that can be evaporated from the skin and thus the body feels hotter than it actually is. This is because the more moisture the air contains, the less moisture can absorb from the skin through perspiration. On the contrary, when the RH is low, we feel same or slightly cooler than the actual temperature because now sweat can be evaporated from the skin.

IMPORTANT

Air temperature gives an indication of how the weather will be like. Relatively warm or relatively cold. However, bodies feel warmer or cooler than it actually is; depending on humidity as mentioned above. Regarding the cooling effect wind speeds also play a crucial role. The combination of actual air temperature, humidity and wind gives the ‘heat index’ and the ‘wind chill’ respectively. This results in the ‘feels like’ temperature which is an important meteorological parameter to look at when people get information about the weather.


  • DEW AND DEW POINT

Dew formation is common at nights when the sky is clear. In clear nights and when the winds are light, the Earth emits heat to space in the form of long wave radiation. This results in the gradual decrease of the Earth’s surface temperature. As the surface of the Earth cools down, so does the lowest layer of the atmosphere which is near the ground. Therefore, the water vapour molecules that are close to the ground are condensed when they reach contact with the cold ground surfaces as well as with other cool surfaces like car glasses. This procedure attracts other water vapour molecules for further condensation and the result is the formation of the water droplets. This moisture, we sometimes notice on the roads and cars early in the mornings, is what we call DEW.


  • What do we call dew point?

Dew point or better dew point temperature is the temperature to which the air with a certain amount of water vapour should be cooled under constant pressure so as the air becomes saturated. In other words, it is the temperature at which we can achieve air saturation which means air relative humidity at 100%.


  • What values can the dew point temperature take?

The temperature to which air becomes saturated or the ‘dew point temperature’ can take any values above 0C. When this temperature is below 0C, then it is not called ‘dew point temperature’ but ‘frost point temperature’.


  • Can the increase or the decrease of the air temperature affect the dew point temperature?

NO, not at all. Neither the increase, nor the decrease of the air temperature affects the dew point temperature. Why is that? Let’s have a look at the example below.

EXAMPLE

If the air temperature is 200C and the RH is 70%, then the dew point is 140C. If we increase the air temperature to 300C, the dew point remains the same at 140C. This is because the RH now has decreased to 40%.

The conclusion from this, is that there is a relation between both air temperature and the RH with the dew point! See now below!


  • Does the increase or decrease in air temperature affect the RH?

Yes. Increase or decrease in air temperature influences the RH. As we mentioned, air can ‘hold’ a maximum amount of water vapour at any given temperature. By raising the air temperature, air can then ‘hold’ more water vapour compared to what the air holds at a lower temperature. Thus, given that the amount of water vapor stays the same, or the moisture in the air remains constant, an increase in the temperature leads to a decrease in the relative humidity and vice versa. That’s why in the example above the RH decreases when we raise the temperature !!


What about dew point then??


  • What factors can modify the dew point?

Dew point is in relation with the absolute humidity or in other words with the actual amount of water vapour in the atmosphere.
Hence, changes in the absolute humidity lead to changes in the dew point as well.
An increase in the absolute humidity induces an increase in the dew point values and vice versa.

CONCLUSION

In order to reduce the dew point temperature and consequently the chances of vapour saturation inside a room, we should reduce the absolute humidity values. This can be achieved by reducing the production of water vapour inside the room which can be done by proper ventilating.   


  • Dew point is an important meteorological element. Why?

Dew point is an essential weather element that aids the forecasting procedure for different regions. Therefore, dew point is always mentioned to weather maps with the symbol D.P.. In aviation meteorology, two figures are usually used to define temperature (e.g. 10/4). The number 10 (100C) gives the air temperature and the number 4 (40C) gives the air dew point. Both temperatures help us to find out how humid the air is and this makes it important especially for the airfields. For instance, if the air temperature is 150C and the dew point is 60C then the air is dry and the relative humidity is low. On the other hand, if the air temperature is 80C and the dew point 70C, then the air is humid and the relative humidity is close to 100%. In a forecasting perspective, this means that in this case, for example, there is a high chance of fog formation. Consequently, the difference between air temperature and dew point is an essential tool for meteorologists as it helps them in fog forecasting.


  • MOISTURE ON VESSEL’S CARGO


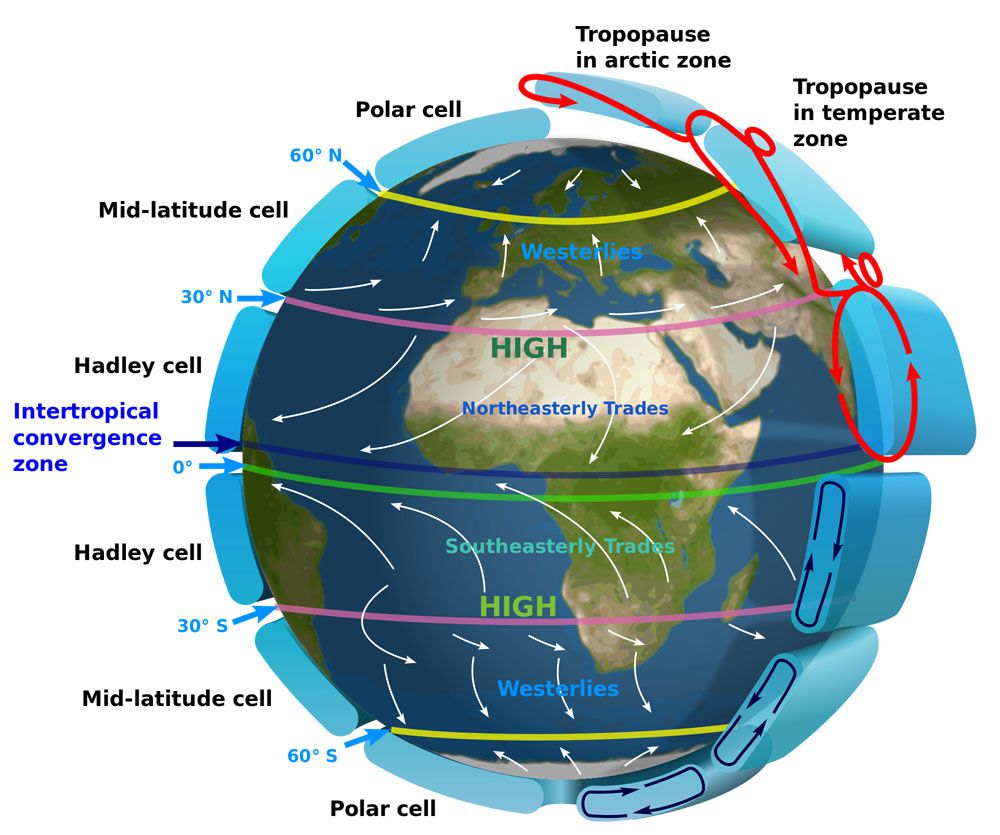
Ships travel long distances at sea where the air is usually humid and can also change climates such as moving from a warm tropical zone to a cold winter zone. These changes can lead to cargo sweat especially when the cargo contains hygroscopic material. Even though hygroscopic products are more in danger, the non-hygroscopic ones such as steel; or products that are packed in hygroscopic material such as wood or paper can also be harmed when exposed to excess moisture.


A) WHAT IS CARGO AND SHIP’S SWEAT?

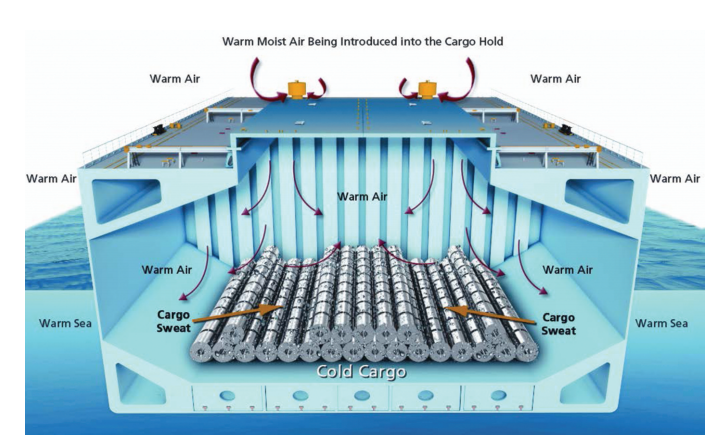
Vessels that carry hygroscopic products, such as sugar, cotton, coffee, cocoa etc have a natural moisture inside them. When excessive moisture occurs, this can lead to cargo damage resulting in mildew or rot. Cargo sweat happens when warm, moist air penetrates into a hold and condenses on the exposed surfaces of colder cargo.

There is also another term called ship’s sweat. This is the condensation of the moist, warm air inside a hold on the vessel’s structure when the vessel moves to colder climates. This can again cause damage to the cargo as overhead drips might develop and condensed water comes in contact with the ship’s side or bottom of the hold where the cargo is located.

The damaged cargo can be rejected from the receivers at the end of the passage leading to cargo claims due to ‘moisture damage’.


Cargo sweat

Ship’s sweat


B) RELATIVE HUMIDITY, DEW POINT TEMPERATURE AND VENTILATION

 As mentioned earlier, as the air temperature rises so does the amount of water vapor the air can hold. As a result relative humidity decreases. When temperature decreases, the amount of water vapor decreases so the potential for condensing the water from gas to liquid form increases. The condensation is greater when temperature falls from very high to very low values.

In general, the air always contains some amount of moisture and it is never totally dry. On the other hand, air is rarely saturated except long periods of rain or fog. So the amount of water that air can hold depends on the prevailing conditions. Air temperature at the deck will generally have a relative humidity of 80% or more when the ship is over the open ocean.


Dew Point temperature is also an important element, apart from relative humidity, when considering levels of moisture at a vessel.

When it comes to the decision to ventilate, dew point temperatures should be measured and compared. These are the dew point of the air and the dew point of the air inside the hold. The air dew point can be measured with wet and dry bulb thermometers while the dew point of the air in the hold with a ‘whirling psychrometer’.


But WHEN SHOULD VENTILATION TAKE PLACE?


Now that we have the measurements we need to check:

  • The dew point rule :

VENTILATE if the dewpoint inside the hold is higher than the air dewpoint outside the hold.

DO NOT VENTILATE if the dewpoint inside the hold is lower than the air dewpoint outside the hold.


  • The three degree rule :

Sometimes the accuracy of the dew point temperature inside the hold is ambiguous. In such cases we can compare the average temperature of the cargo at the time of loading with the outside air temperature.


IF the dry bulb temperature of the air is at least 3 degrees cooler (>=3o) than the cargo temperature then VENTILATE

DO NOT VENTILATE if the dry bulb temperature of the air is less than 3 degrees cooler (<3o) than the cargo temperature.


It’s also important to note that if the vessel travels from hot climates to cold climates then the cargo that contains hygroscopic products needs ventilation while on the other hand not.

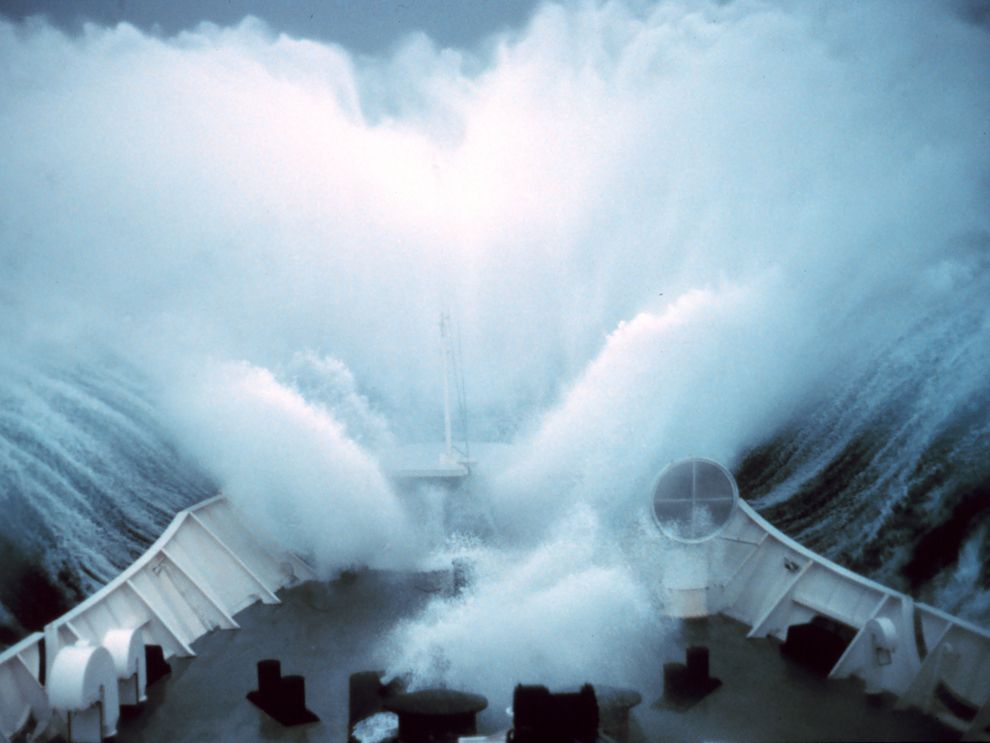
HOWEVER, in heavy weather situations, when rain and sea spray can spread into the vessel, precaution measures should be taken in order to avoid rain and spray entering the hold where the cargo is kept. In such circumstances, ventilation should be suspended until weather improves.


Last but not least, it’s important not to forget the ventilation during the night when air temperatures are lower so ship sweat is more likely than during the day.


Author: Triantafyllia Sideri / Operational Meteorologist